
Recently I have been developing Immutable zkEVM’s in-house bridge monitoring solution.
We have built a framework, with a number of automated tools, and integrated Github actions to create a powerful workflow to securely manage our critical bridge alerting environment. To achieve this, we designed an ergonomic JSON file convention that is put into a pipeline of reviews and scripts that transform this file eventually into direct API calls that reliably update and create new alerts, or “monitors”. These monitors are highly configurable and are, most importantly, simple. Simplicity is key to making sure reviews catch anything that might have leaked through the cracks. This is a significant and tangible improvement from an inauditable and unrestricted UI web app.
Hexagate is the platform we use for chain state monitoring. We use it for a large number of alerts. For example, they provide “event emission” monitors (self-explanatory), “balance change” monitors (also self-explanatory), “sample function” monitors (ensures a view function is as expected), among many others.
Terminology
(note that some of this terminology might not be exactly as it is called in Hexagate. I may have changed some words for simplicity.)
- monitor: A grouping of
{condition, notification channels, severity, notification period}. Thenotification channelswill be alerted when theconditionis not satisfied. - condition: A condition can take two forms:
- Enforcing equality, inequality, or a comparison at a state slot or combination of state slots. For example “
Contract.a()returns exactly 1000”. - An event occurring. e.g a threat detection, event emission, or function call.
- Enforcing equality, inequality, or a comparison at a state slot or combination of state slots. For example “
- rule: Same as condition.
- entity: A pair of
{address, chain ID}, which specifies a particular address and network to monitor for certain conditions. - notification channels: These are the ways developers can be notified of a condition failing. e.g. emails, Slack channels, OpsGenie, Rootly.
- severity: This abstractly refers to both the Hexagate-level severity (which is just for readability of alerts) and the severity of the on-call alert (determining whether it wakes up a developer).
- tag: a string that can be applied to multiple monitors. It can be used for grouping and classification.
- notification period: The time interval between consecutive notifications/alerts.
- notification interval: Same as notification period.
Explaining Hexagate
Hexagate has four main monitor types. These are:
- Threat monitors
- Custom template monitors
- Invariant monitors
- Multi-monitor triggers
Threats monitors
This one is a bit of a black box. It utilises Hexagate’s “pre-built out-of-the-box models” (ML? Heuristics? Probably a bit of both).
Custom template monitors
We rely on custom template monitors the most. These are split into the following types of custom template monitors:
- Sample Function
- Function Call
- Contract Event
- Balance Changed
- Address Fund Movement
- Multisig Tx Status
- Safe Fund Movement
- Health Factor (e.g. Aave position health)
- Token Holder Centralization
- Fake Token
- Token Movement
- Token Depeg
- Ones relating to price change
- Others
Invariant monitoring
Invariant monitors in Hexagate are very handy. Hexagate have developed their own declarative DSL called Gatelang, allowing you to define custom invariants.
Multi-monitoring triggers
This is just combining multiple monitors with boolean operators.
The problem
The problems we had with this monitoring solution are:
- Lack of traceability
- Potential for human errors
When using the Hexagate UI, there are limitations. You can not:
- quickly revert changes
- see a historical trace of changes
- review changes before they make their way to prod
- test changes consistently before making their way to prod
- control who is able to make which changes
These reduces overall confidence in monitors not diverging from the correct state. For an environment as critical as the network’s native/canonical bridge, this is an unacceptable risk.
The Solution
Hexagate offers an API that allows you to make modifications to the Hexagate environment programatically. You can create, modify, and delete monitors, notification channels, and tags.
We decided that we wanted to build a set of tools that would allow us to manage our entire bridge monitoring and alerting environments in version control.
We use a combination of Github CI, in-house typescript programs, and Hexagate custom networks (discussed below) to create a workflow that would allow us to solve every problem listed above. Let us look at how each problem is addressed.
-
Changes can be reverted quickly because a change will be represented as a series of git commits merged through a Github PR. Therefore, changes can be reverted the same as any other git commits/merges.
-
A historical trace of all changes are provided by
git logor the Github UI. -
Since all changes must go through pull requests, changes will all be reviewed.
-
We use custom networks and typescript code to actually test monitors automatically in CI, which will be required to pass before any changes can be merged and pushed to prod.
-
Github provides the flexibility required to specify whose approval is required for all changes. This allows us to have control over who has authorisation to make changes in prod. Granted, this doesn’t allow us to have granularity over which changes individuals are able to make. This can be enforced at the human level.
The design
 Let’s run through a high level explanation.
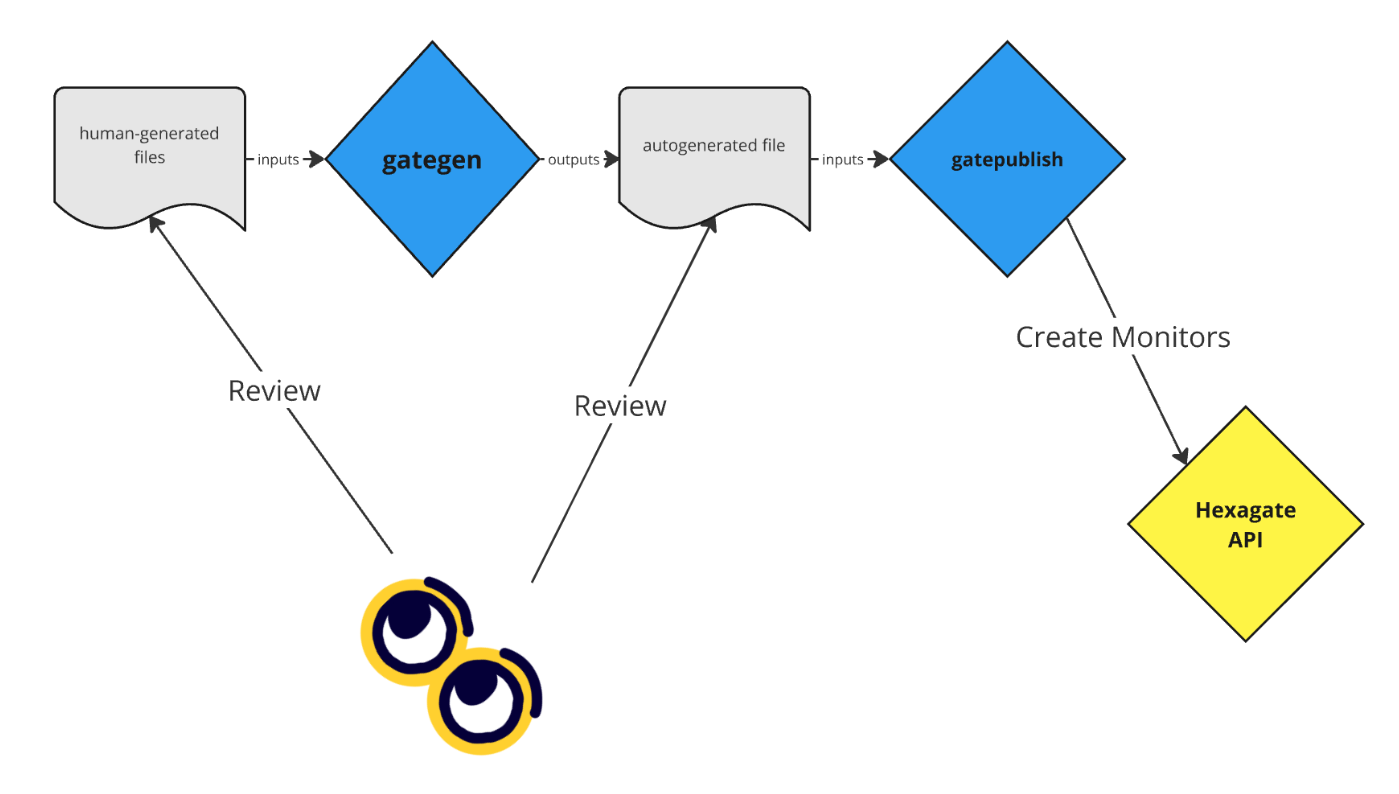
Firstly, the maintainers will produce a series of files. The format for these files is described below, but to put it simply these files are what specifies the entities and conditions. Each file applies a list of conditions to all of the entities specified.
These human-generated files are taken as input by a Typescript script called gategen. This script gets these conditions and entities and does a number of things:
- Generates the monitor names and tags
- Allocates notification channels to the monitors, based on the severity provided
- Validates all parameters, including function/event signatures and notification intervals.
The output is the resultant auto-generated file. This auto-generated file is generated and included as part of the PR that would introduce changes. Both this and the human-generated files are reviewed by the reviewer. The Github CI also generates its own version of the auto-generated file based on the human-generated files, which it compares against the one includes in version control.
When a change is merged into the main branch, an action is run to use custom networks to actually test the monitors (explained below) before running a script called gatepublish. gatepublish does the following:
- deletes unused tags
- creates new tags
- creates new monitors, skipping monitors that already exist
This may sound simple, but there are complications involved. First, we have to handle how we update pre-existing monitors. In this regard, the current state is different to the ideal final state.
In its current state, we have a Github action for deleting a monitor. Then, gatepublish will see that a monitor doesn’t exist and re-upload it. This means that for a monitor to be updated (for example, to change its notification period), we have to first delete it using this Github action.
So how does gatepublish determine if a particular monitor exists? Using tags! Since the id field of a monitor can be arbitrarily determined, and doesn’t provide any information about the monitor itself, we have to use some form of metadata to determine uniqueness. I decided to programatically apply a unique tag to each monitor. If two monitors with the same tag exist, we have a duplicate. This means that uniqueness is enforced at the application level rather than the infrastructure level, which is a risk to be cognisant of but can be mitigated with testing and reviews.
The rest of the software complexity comes from the fact that we have to support numerous monitor types, which all have their own logic (as well as overlapping logic).
Testing monitors with custom networks
Let’s say we have a monitor that fires when an event called VeryBadThingHappened is emitted. In production, we can’t test this monitor because we can’t make a very bad thing like this happen unless there is a real bug in the smart contracts.
To simulate bugs existing in smart contracts, and test monitors against these scenarios, we need to use custom networks alongside Tenderly. Tenderly allows us to make simulated fork networks that we have complete control over. In these networks, we can modify any storage slot of any address.
This means we can test a monitor that should trigger if the token balance of an address is dropping rapidly. It’s simply a matter of decrementing a number quickly. Ok, maybe it’s a bit trickier than that.
Writing an automated testing framework for all of our monitors was no easy task. Another engineer on my team was doing most of the dirty work in this specific regard. Generalising these tests definitely took some work, but now we have a tool we can use to spin up custom networks and easily create desired scenarios.
The result is an extensive testing framework that can be integrated into the workflow of creating and updating monitors.
Our monitors
The monitor types we rely on almost exclusively are sample function, function call, contract event, balance change over time, and invariant monitors.
- Sample function monitors are for conditions where you require a particular state variable or other
viewfunction to return a particular value (or range of values). - Function call monitors are for conditions of a particular function being called, perhaps with a certain
msg.sender, certain parameters, or with a revert. - Contract event monitors fire when a particular smart contract event is emitted.
- Balance change over time monitors are for conditions where a particular address’s balance has {increased, decreased} by a certain percentage over a certain period of time.
In the bridge smart contracts, there are a few key things that we care about.
Cross-chain invariants
The first is our cross-chain invariants. There are two main ones. First, that the L1 bridge balance of any given token should be greater than or equal to the total supply of that token on L2. Second, that every message received on a chain should have a corresponding message sent on the source chain. To achieve this, we wrote a number of Gatelang invariant monitors. This overall wasn’t an easy task. There was a big complication for both of these monitors.
The complication for the first monitor was that we need to account for in-flight withdrawals. This is logically simple but a challenge to make work given Gatelang’s limited and declarative nature.
The complication for the second monitor was strict equality. It was easy to monitor for “for each message received, at least one equivalent message has been sent”, but interestingly this wouldn’t detect a double-spend attack! Gatelang didn’t have the functionality required to make this monitor complete, so we worked with the Hexagate team to eventually devise the group-by functionality. This allowed us to count how many times a given message had been sent and received and therefore ensure strict equality on both sides.
Withdrawal queue activation
The Immutable bridge has the concept of a “withdrawal queue”. If certain the “flow rate” for a given token is exceeded - which is to say too much of it has been withdrawn in a certain period of time - the withdrawal queue is activated. This is a security measure to help us assess if anything is wrong during periods of large withdrawals. People can still withdraw their assets, they just have to wait 24 hours.
If the withdrawal queue is activated, we need to know about it in order to analyse the activity on the bridge contracts.
Role changes
Understandably, the bridge contracts have certain roles that are typically used for deactivating the withdrawal queue, or making parameter changes. If any of these change, it should be something the team is aware of in advance. If a role changes and people aren’t expecting it, we should be alerted.
axlUSDC/USDC price deviation
This may initially seem like it’s not related to our bridge, but our team still owns the relationship with Squid. Squid uses axlUSDC as its routing token, and Immutable provides liquidity for the axlUSDC/USDC liquidity pool. If the price has deviated far from 1:1, this will tangibly impact users bridging via Squid.
Failed transactions
It’s normal for EVM transactions to fail. However, a failed transaction on our bridge could be an indication that something else is wrong, like fee estimations in our bridging widget. Therefore, we want an informational alert to let us know if things keep going wrong on the bridge. It would be nice if this was more customisable. For example, more than x failures per hour. At the moment this is not supported.
Large withdrawals
Much like failed transactions, there is nothing wrong with large withdrawals. We still want to be informed of them just in case.
Parameter changes
Naturally, there are a lot of parameters in the bridge which are typically controlled by a large multisig committee. For example, the withdrawal flow rate parameters. If this flow rate is removed, we’d probably want to know about it as this would probably not be intended.
Conclusion
At Immutable, we were able to build a pretty nice, and useful, tool to improve the robustness and assurances around our internal bridge monitoring. We achieved this by developing a very human-friendly tool to add multiple degrees of resilience to modifications in our monitoring and alerting environment. I am very happy that I was able to make such significant contributions to Immutable’s in-house tech and security infrastructure. :)
I learnt a lot while leading this project.
Largely, my learnings come in the form of soft skills. I got some good practice in project planning, software design, and engineering resource management. Because this was a project that spanned a number of months, our engineers would often have competing tasks. This meant being realistic with estimates but also with prioritisation. A problem with critical partners should probably come before this (in the short term).
I also got some good practice in hard tech skills. Namely, using an external API with limited documentation, creating my own technical documentation, building a project from scratch, and going through multiple iterations of software design/refactoring.